SBT Parallel Compile Optimizations using Quill Sub-Projects


Advanced syntax constructs and a robust type system can increase developer productivity and runtime reliability but also create extra work for the compiler. Macro libraries such as Quill are effectively programs written for the compiler, and can represent an unbounded amount of work depending on what they are trying to accomplish. Are there ways to structure our Scala 3 code to ensure that we can embrace the rich macro ecosystem without excessively long compile times?
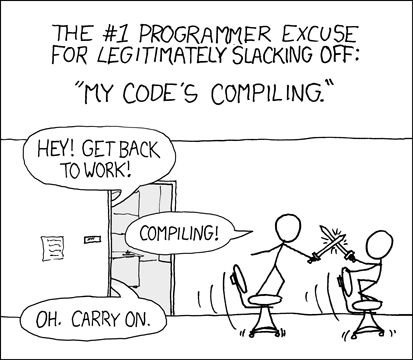
Symptoms of a Slow Compile
As Scala 2 matured compiler optimizations brought compilation times down, but the Scala 3 rewrite to TASTy reset many optimizations back to zero. This article is an analysis of the steps used to optimize a Scala 3 project making heavy use of macros via Quill.
Quill is a macro library that adds compile-time query generation to the JVM. It is similiar to other type-safe SQL generators such as Slick in how SQL is constructed using abstracted functions, but different in that the SQL is generated in the compile phase rather than dynamically during runtime. So while the compile times may be slower in Quill, it eliminates a significant class of runtime errors. This is a trade-off between compilation speed and compile-time functionality.
The example project is outlined in the previous post ZIO Migration from Akka and Scala Futures, and consists of over 120 SQL query macros of varying complexity, with some larger queries requiring over 5 minutes to complete and over +5GB of heap.
Is The Scala 3 Compiler Optimized?
Simple answer, no - but that’s a good thing: it will get better as Scala 3 matures. The switch from Scala 2 to Scala 3, for the same functionality, represented twice as long compile times:
| Implementation | Scala 2 | Scala 3 |
|---|---|---|
| Slick | 45s | n/a |
| Quill | 4m 17s | 8m 42s |
While Scala 2 macros aren’t apples-to-apples with Scala 3, the end functionality in Quill is the same a difference this large wouldn’t exist if Scala 3 was optimized.
Problems Encountered
Increased Heap Space Requirements
Compilation times can be affected by the amount of RAM available. Scala 3 Quill macros were observed to require significantly more memory, even failing to compile with the JVM defaults.
[error] -- Error: /home/runner/work/tradeauditserver/src/main/scala/SQLWeb.scala:46:16
[error] 46 |      quill.run(q).map {
[error]    |                ^
[error]    |                Exception occurred while executing macro expansion.
[error]    |                java.lang.OutOfMemoryError: Java heap space
[error]    |
[error]    |----------------------------------------------------------------------------
[error]    |Inline stack trace
[error]    |- - - - - - - - - - - - - - - - - - - - - - - - - - - - - - - - - - - - - -
[error]    |This location contains code that was inlined from Context.scala:80
Struggling garbage collection can have non-fatal effects, the compiler will warn when the amount of memory available is an issue.
[warn] In the last 10 seconds, 6.884 (70.9%) were spent in GC. [Heap: 1.84GB free of 3.34GB, max 5.33GB]
Consider increasing the JVM heap using `-Xmx` or try a different collector, e.g. `-XX:+UseG1GC`, for better performance.
Macros Blocking Threads Preventing Multithreading
Long-running macros (taking over 1 minute) were observed to block compiler from running other threads.
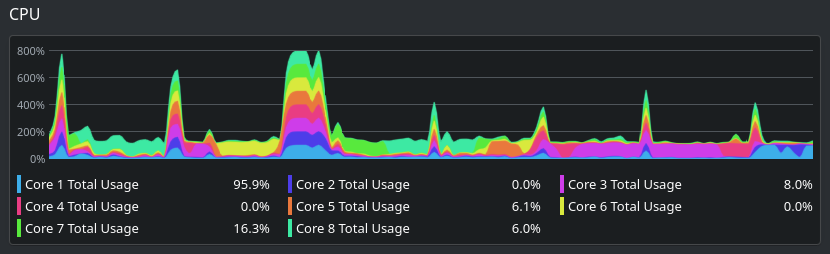
This wasn’t observed to be an issue in all projects, it appeared to be specific to macros being forced to run sequentially within the same project. For SQL heavy projects, non-macro code is quickly compiled, resulting in idle cores. Ideally, the entire compile task should use multithreading from start to finish.
Code Refactoring and Configuration Changes
Increased Heap Space
Optimizing for the Build Server Hardware
Whether compiling locally or in a remote CI/CD the build should be optimized to the hardware available. The 2 primary considerations are CPU and RAM.
Most often it is optimal to match the number of threads to the number of cores to limit context switching. Depending on workload, for N cores, an N-1 thread limit can be used if there are heavy background/system threads running concurrently, as well an N+1 thread limit can be used if thread tasks are short-lived. After an optimal N is determined, an explicit declaration in the build.sbt can ensure parallel execution in SBT matches our expectations.
Compile / parallelExecution := true

Global / concurrentRestrictions := {
  val max = java.lang.Runtime.getRuntime.availableProcessors()
  Seq(
    Tags.limit(Tags.CPU, max),
  )
}
We are working under the assumption that each of your SBT projects will run into serialization bottlenecks, meaning each project will eventually be consuming only a single thread
GitHub Actions CI/CD
GitHub Actions compile code on dedicated runners that have ubuntu-latest provisioned at 2 core, 7 GB RAM, 14 GB SSD.
The SBT_OPTS environmental variable within the action YML file should be set to allow SBT to use all available resources.
name: ..
env:
  SBT_OPTS: "-Xmx6G"
jobs:
  build: ...
Idea IntelliJ
When compiling locally an optimal resource allocation may need to be restricted to allow other applications to continue to function. IntelliJ has its own resource requirements, so depending on the machine configuration the compile settings may be lower than on a dedicated CI/CD runner.
SBT_OPTS="-Xmx12G -XX:+UseParallelGC" sbt
JVM GC Alternatives
There aren’t many Scala 3 compiler parameters we can affect; one is the besides allocating more memory one is There are alternative JVM garbage collectors that may offer better performance by prioritizing different factors. Currently, the JVM has 4 available GC implementations:
- Serial Garbage Collector (+UseSerialGC)
- Parallel Garbage Collector (+UseParallelGC)
- G1 Garbage Collector (+UseG1GC)
- Z Garbage Collector (+UseZGC)
There is more information available, the parallel garbage collector has multiple configuration options and focuses on throughput over latency making it an interesting choice to experiment with.
All 4 garbage collectors serve different purposes, none are antiquated or only exist for legacy purposes. The default G1 implementation has most general applicability, we will see that for our use-case the Parallel implementation has the best performance. While the Serial implementation may target smaller systems, it is still considered a generic throughput oriented implementation and is the default choice for the Java 21 GraalVM compiler from Oracle. The Z implementation is still in development tuning, and targets large-scale heap sizes and cores available in the top end hardware available today.
Forced Parallelized Builds using Sub-Projects
SBT will concurrently compilation and many projects won’t require intrusive refactoring to allow compiler multithreading. However, it appears that macros represent an edge case where Scala 3 can’t always figure things dependencies. Quill query macros would not be compiled in parallel whether in separate methods, separate classes or separate packages.
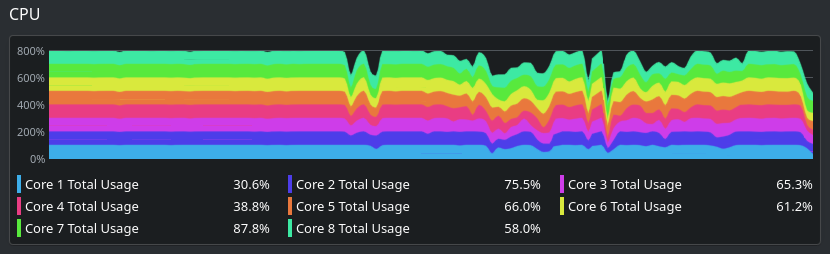
To force concurrency of macro compilation, the significant code change was made to break-up queries into independent SBT projects.
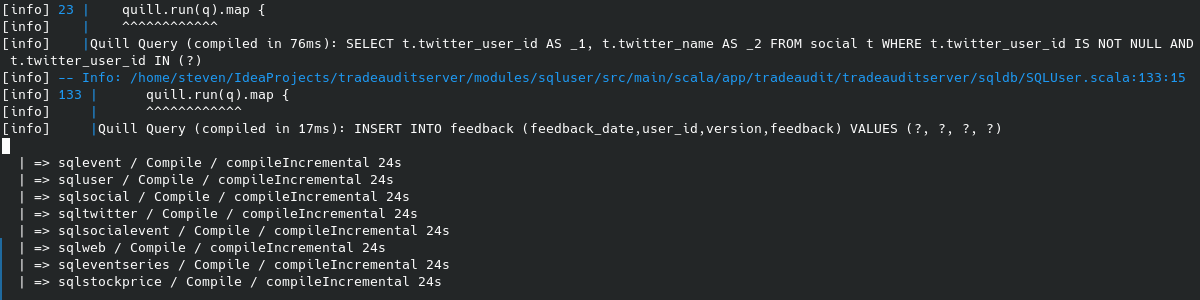
compileIncremental tasks executing concurrently
Basic Sub-Project Template
Scala 3 projects can be minimally defined with only 2 additional SBT build files:
$ tree
.
├── build.sbt
├── SQLUser.scala
└── project
    └── build.properties
The build.properties simply contains sbt.version=1.9.6
SBT subprojects will inherit properties from the root project so the build.sbt will only need to define
project dependencies. Our typical build.sbt used for each Quill subproject is similar to:
name := "sqluser"
version := "0.1.0-SNAPSHOT"
organization := "app.tradeaudit.tradeauditserver.sqldb"

scalaVersion := "3.4.0"

val javaVersion = "17"

lazy val sqlcommon = RootProject(file("../sqlcommon"))

lazy val sqluser = (project in file("."))
  .dependsOn(sqlcommon)
  .aggregate(sqlcommon)
  .settings(
    scalacOptions ++= {
      Seq(
        "-encoding", "UTF-8",
        "-deprecation",
        "-feature",
        "-unchecked",
        "-language:experimental.macros",
        "-language:higherKinds",
        "-language:implicitConversions",
        "-Ykind-projector",
        "-Ysafe-init",
        // "-Xfatal-warnings"
      )
    },
    javacOptions ++= Seq("-source", javaVersion, "-target", javaVersion),
  )
Root Project Structure
The build.sbt in the root folder contains the diamond pattern project structure, with common dependencies containing
in the sqlcommon project, fanning out to sql* projects, and then aggregated again in root.
//Compile time 5:03
lazy val sqlevent = RootProject(file("modules/sqlevent"))
//Compile time 2:18
lazy val sqlsocial = RootProject(file("modules/sqlsocial"))
//Compile time 1:09
lazy val sqlsocialevent = RootProject(file("modules/sqlsocialevent"))
//Compile time 0:14
lazy val sqluser = RootProject(file("modules/sqluser"))
//Compile time 0:11
lazy val sqltwitter = RootProject(file("modules/sqltwitter"))
//Compile time 0:15
lazy val sqlweb = RootProject(file("modules/sqlweb"))
//Compile time 0:34
lazy val sqltag = RootProject(file("modules/sqltag"))
//Compile time 0:36
lazy val sqlnote = RootProject(file("modules/sqlnote"))
//Compile time 0:10
lazy val sqlstockprice = RootProject(file("modules/sqlstockprice"))
//Compile time 0:14
lazy val sqleventseries = RootProject(file("modules/sqleventseries"))

lazy val root = (project in file("."))
  .dependsOn(
    sqlevent, sqlsocial, sqlsocialevent, sqluser, sqltwitter,
    sqlweb, sqltag, sqlnote, sqlstockprice, sqleventseries
  )
  .aggregate(    sqlevent, sqlsocial, sqlsocialevent, sqluser, sqltwitter,
    sqlweb, sqltag, sqlnote, sqlstockprice, sqleventseries
  )
See the SBT documentation on how aggregate is
different from dependsOn.
The project order used in aggregate is important, placing longer running subprojects first allowing them to begin
immediately. SBT will execute compile tasks in separate threads starting from left-to-right when no other dependencies
preventing it. Once threads complete, they will begin to pick up the smaller projects later in the order.
Limitations and Downsides
Approach is very similar to a microservice approach, has the same benefit of separation of concerns, but same downsides:
- Increased maintenance
- Initiation overhead
- Parallel execution continues to run if an exception is encountered.
This example is a diamond pattern where all sub-projects are aggregated into the same root, but could easily turn this codebase into a multi-headed project.
Optimized Results
The following compilations were performed on a 4.2GHz x 8 core server,
with sbt 1.9.6, Scala 3.3.1, Eclipse Adoptium Java 21.0.1.
The end result is a 30% reduction in compile time from 13:39 to 9:18.
Compile Times With and Without Sub-Projects
We find that by breaking down our monolithic Quill project into subprojects, the resulting parallelization allowed for faster compilation with lower Heap memory requirements.
| Sub-Projects | Minimum Heap Required | Serial GC | Parallel GC | G1 GC | Z GC |
|---|---|---|---|---|---|
| No | > 6GB | 15:46 | 13:53 | 13:39 | 41:52 |
| Yes | 3 GB | 10:56 | 9:18 | 9:29 | 13:14 |
Reductions in Heap had the most significant effect on compilations on the standard GitHub Action runners. With SBT configured to use all 7GB available, compilations within GitHub CI/CD reached an average of 16:48 in length with continual warnings about GC CPU usage under all garbage collectors. After optimization GitHub compilation times dropped to 11:11, which is a 33% improvement, matching our local build server.
Garbage Collection and JVM Configurations
Additional optimizations are possible unrelated to subproject parallelization within JVM configuration. The
latest JRE available, openjdk-bin-21, improved compilation times from 9:52 to 9:18, 5.7% improvement from
openjdk-bin-17.
The configuration from the default (G1) garbage collector to the Parallel garbage collector resulted in a 2% improvement, reducing compilation times from 9:29 to 9:18. From the Oracle documentation on the parallel GC indicates it may offer better throughput when latency isn’t being prioritized:
The parallel collector is also known as throughput collector, it’s a generational collector similar to the serial collector. The primary difference between the serial and parallel collectors is that the parallel collector has multiple threads that are used to speed up garbage collection.
| Heap Allocated | Parallel GC Compilation Time | G1 GC Compilation Time |
|---|---|---|
| 4 GB | ¹ 10:58 | 10:02 |
| 5 GB | 9:06 | 9:42 |
| 6 GB | 9:19 | 9:39 |
| 10 GB | 8:52 | 9:26 |
| 12 GB | 9:18 | 9:29 |
¹ A maximal warning of 78% GC CPU was encountered, indicating insufficient RAM allocation


